

You know what to do

Data presented below is in averages, allowing for direct comparisons between active Managers and, in two instances, inactive Managers with 2+ years of experience.
Statistics
Download Raw Data here. Check for accuracy. Draw new conclusions.
Composite Rank: averages an active Manager's rank across 7 all-time
categories to determine the GOAT and, relatively, which gentlemen are most extraordinary.
NEW
*Updated through LEG XXI, the 2024 season.
*(E +N -N ) Denotes each Manager's delta in a given category from 2023.
Download 2020 IDP Data here. Snapshot provided by Steven Taseski.
*Data skewed due to law of large numbers and varied sample sizes
All-Time
Winning Percentage
Trended

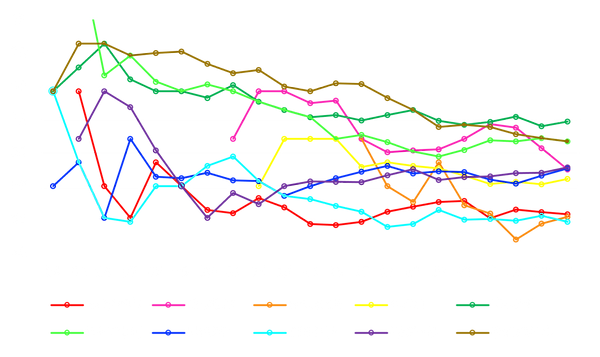
Managers with 2+years experience
Shades of Gray = Inactive Managers
Active managers
*'04&'05 data points (>70%) for Ottolini not displayed for better viewing*

Active Managers
Reg. Season Winning%
1. 59.73% Paul Knapp E
2. 56.71% Jonathon Ottolini E
2. 56.71% Evan Wismans E
4. 52.82% Steven Taseski +1
5. 52.68% Stephen Sharp +1
6. 52.50% Peter Deacon -2
7. 51.08% Ryan Hunt E
8. 45.78% Michael Bendert E
9. 45.38% Christopher Hauger +1
10. 44.63% Mark Steiner -1
All-Time
Winning
Percentage
*regular season only
Composite Rank Stat
.png)
Active Managers
Avg. Fin. Position
1. 4.286 Paul Knapp +2
2. 4.333 Jonathon Ottolini E
3. 4.429 Peter Deacon -2
4. 4.952 Evan Wismans E
5. 5.000 Steven Taseski E
6. 5.231 Ryan Hunt +1
7. 5.286 Stephen Sharp -1
8. 6.222 Christopher Hauger +1
9. 6.300 Michael Bendert -1
10. 6.714 Mark Steiner E
All-Time
Avg. Finishing
Position
*Playoffs included, consolation excluded
Composite Rank Stat
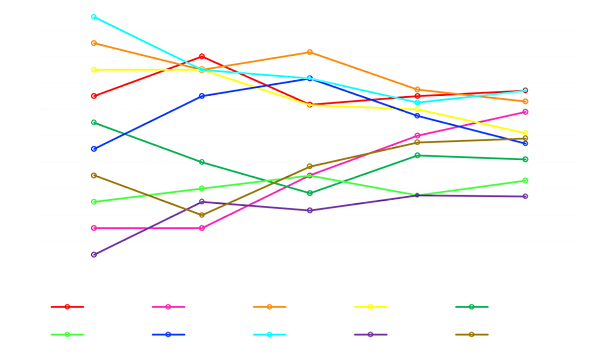
All-Time
avg. finishing Position
Trended


Managers with 2+years experience
Shades of Gray = Inactive Managers
*Wojcik managed in '04-'05 when LEG had 12 teams*
Active managers
LAST 5 YEARS
Winning Percentage
Trended
LAST 5 YEARS
WINNING PERCENTAGE


Active managers
Active Managers
Last 5 yrs RS Win%
1. 63.51% Jonathon Ottolini E
2. 59.45% Paul Knapp +1
3. 58.11% Steven Taseski +1
4. 54.05% Stephen Sharp E
5. 50.00% Evan Wismans +2
6. 48.65% Ryan Hunt +1
7. 47.30% Peter Deacon -5
8. 40.54% Michael Bendert +1
9. 39.19% Christopher Hauger +1
9. 39.19% Mark Steiner -3
LAST 5 YEARS
Winning
Percentage
*regular season only
Active Managers
Last 5 yrs AFP
1. 3.2 Steven Taseski +2
2. 3.8 Jonathon Ottolini -1
3. 4.6 Paul Knapp +1
4. 5.2 Stephen Sharp E
5. 5.4 Evan Wismans +1
6. 5.6 Ryan Hunt +3
7. 6.4 Peter Deacon -5
8. 6.8 Christopher Hauger -1
9. 7.2 Michael Bendert +1
9. 7.2 Mark Steiner -2
LAST 5 YEARS
Avg. Finishing
Position
*Playoffs included, consolation excluded
LAST 5 YEARS
AVG. finishing Position
Trended
LAST 5 years
avg. finishing position

Active managers

Active Managers
% of playoffs made
1. 57.14% Peter Deacon E
1. 57.14% Paul Knapp +1
3. 55.00% Steven Taseski E
4. 52.38% Stephen Sharp +1
5. 47.62% Jonathon Ottolini -1
5. 47.62% Evan Wismans -1
7. 33.00% Christopher Hauger E
8. 30.77% Ryan Hunt +2
9. 30.00% Michael Bendert -1
10. 28.57% Mark Steiner -1
All-Time
% of
Playoffs Made
Composite Rank Stat
Active Managers
% of seasons In-the-money
(Top 3 Finish)
1. 50.00% Peter Deacon E
2. 45.00% Steven Taseski +1
3. 42.86% Jonathon Ottolini -1
4. 38.10% Paul Knapp E
4. 38.10% Evan Wismans E
6. 28.57% Stephen Sharp E
7. 23.08% Ryan Hunt +1
8. 22.22% Christopher Hauger -2
9. 20.00% Michael Bendert -1
10. 19.05% Mark Steiner -1
All-Time
% of
Top 3 Finishes
Composite Rank Stat
Active Managers
% of Turdells won
1. 23.81% Jonathon Ottolini E
2. 21.43% Peter Deacon E
3. 19.05% Stephen Sharp E
4. 14.29% Paul Knapp -1
4. 14.29% Evan Wismans -1
6. 05.00% Michael Bendert E
6. 05.00% Steven Taseski E
8. 00.00% Christopher Hauger E
8. 00.00% Ryan Hunt E
8. 00.00% Mark Steiner E
All-Time
% of
Turdells Won
Composite Rank Stat
Active Managers
% of seasons > .500
1. 71.43% Peter Deacon E
2. 66.67% Evan Wismans E
3. 65.00% Steven Taseski E
4. 61.91% Paul Knapp E
5. 52.38% Jonathon Ottolini E
6. 47.62% Stephen Sharp E
7. 46.15% Ryan Hunt E
8. 44.44% Christopher Hauger E
9. 35.00% Michael Bendert E
10. 28.57% Mark Steiner E
All-Time
% of
Seasons > .500
Composite Rank Stat
Active Managers
% of seasons <.500
1. 14.28% Paul Knapp E
2. 25.00% Steven Taseski +2
3. 28.57% Peter Deacon -1
3. 28.57% Jonathon Ottolini E
5. 30.77% Ryan Hunt +1
6. 33.33% Stephen Sharp +1
6. 33.33% Evan Wismans -1
8. 55.00% Michael Bendert E
9. 55.56% Christopher Hauger +1
10. 61.91% Mark Steiner -1
All-Time
% of
Seasons < .500
Composite Rank Stat

Active Managers
Composite Rank
1. 2.29 Paul Knapp +1
2. 2.43 Peter Deacon -1
3. 3.00 Jonathon Ottolini E
4. 3.57 Steven Taseski +1
5. 3.86 Evan Wismans -1
6. 5.29 Stephen Sharp E
7. 6.86 Ryan Hunt E
8. 8.14 Christopher Hauger +1
9. 8.29 Michael Bendert -1
10. 9.71 Mark Steiner E
Composite Rank
Average of Seven
All-Time Categories

_edited.png)